Could it really get much worse from these levels?
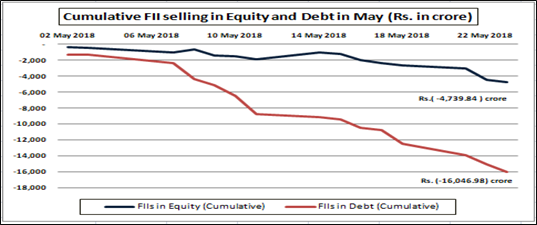
A recent report by HSBC underscores the risk of higher capital outflows from equity and debt. FPIs have been net sellers in the last couple of months. In the month of May alone, FPIs have sold over $3.50 billion in equity and debt put together. As the chart above suggests, the FIIs have been almost selling on all the day. What does it portend?
It could be about rate spreads…
For the casual observer, the entire game of FII buying and selling is all about rate spreads. If the rate spread between the US benchmark 10-year bond and its India counterpart narrows, then it is a fit case for risk-off trading. That is the reason you will see that the FII selling in debt has been a lot more pronounced than in case of equity. Normally, when the FPIs play on global spreads, it is debt that becomes the first casualty. So the RBI will have the real dilemma on whether to hike rates or not. Higher rates will stem outflow but also growth.
Watch out for the rupee…
The INR is very close to its all time low of Rs.68.80/$. This level was touched in July 2013 and has held on ever since. How the FII activity pans out from here on will largely depend on how the INR reacts. As of now the FIIs are betting on the INR to weaken beyond the 70/$ mark, which explains the sustained selling. If the RBI allows the INR to go beyond the 70/$ mark then there could be a bout of panic selling from FIIs to prevent further dollar value depreciation in their portfolio. Then we could see FII outflows deepening from current levels. On the other hand, if the RBI intervenes with special NRI schemes to attract deposits (as in 2013), we could see the rupee rebounding and the FII flows coming back into India. We have seen that trend in 2013 and again in 2016. The level of 70/$ will be critical, which explains why most of the FIIs are just sitting on the sidelines and watching the RBI. It will boil down to the INR!


